This will be the first post in a series of posts that look at the results of the 2019 Bigs Backyard Ultra. The data used in the post below can be accessed here.
Bigs Backyard Ultra is a fall event that takes place in Bell Buckle, TN. As the name implies, the course is actually in a backyard. That backyard belongs to Gary Cantrell aka Lazarus Lake (Laz) the mastermind behind the famous Barkley Marathons. Laz puts on a number of races throughout the year that benefit the local community. All of his races are pretty unique and I urge you to take a look at some of his offerings.
The Bigs Backyard Ultra’s format is new-ish to ultra running. It does not follow the traditional race format of fastest traverse from point A to point B. Or who is able to run the furthest in 12 or 24 hours around a track or loop. The format of Bigs is as follows: runner’s have 1 hour to make their way around a 4.1667 mile loop on Laz’s property. With what time remains at the conclusion of each loop runners are free to do what they want: tend to wounds, eat, hit the bathroom, sleep, cry, etc. At the conclusion of each hour, the next loop starts, and the process repeats itself. Runners compete for as long as they want or as long as their bodies/minds let them.
The race ends when there is only one runner remaining. This last runner is deemed the champion, all other runners earn a DNF.
The performances that have come out of this race are extraordinary. In 2018 Johan Steene and Courtney Dauwalter battled for 279 plus miles (!!!). The issues that plague runners in this event are not unknown at other ultra events. Fatigue, minor injuries, fueling, hydration, and sleeplessness are all things that every ultra runner contends with. In this format, there is no end in sight. This makes runners (presumably) deal with the issues longer and without a known horizon. Mental fortitude is key in this format.
This past year’s edition started on Saturday October 19th 2019 with 72 runners toeing the line and concluded on Monday the 22nd of October 2019 with Maggie Guterl as champion. Race reports can be found on the group’s facebook page). As a start, I recommend reading winner Maggie Guterl’s fueling strategy, Amelia Boone’s journey to the starting line and push for 100 plus miles, and runner-up Will Hayward’ drive to push beyond his limits.
Now let’s dig into some of the stats from this years Bigs Backyard Ultra:
The drop out rate can be shown using survival analysis. The kaplan-meier plot gives the survival rate over the duration of the race. The survival plot for this year’s Bigs Backyard ultra is shown below.
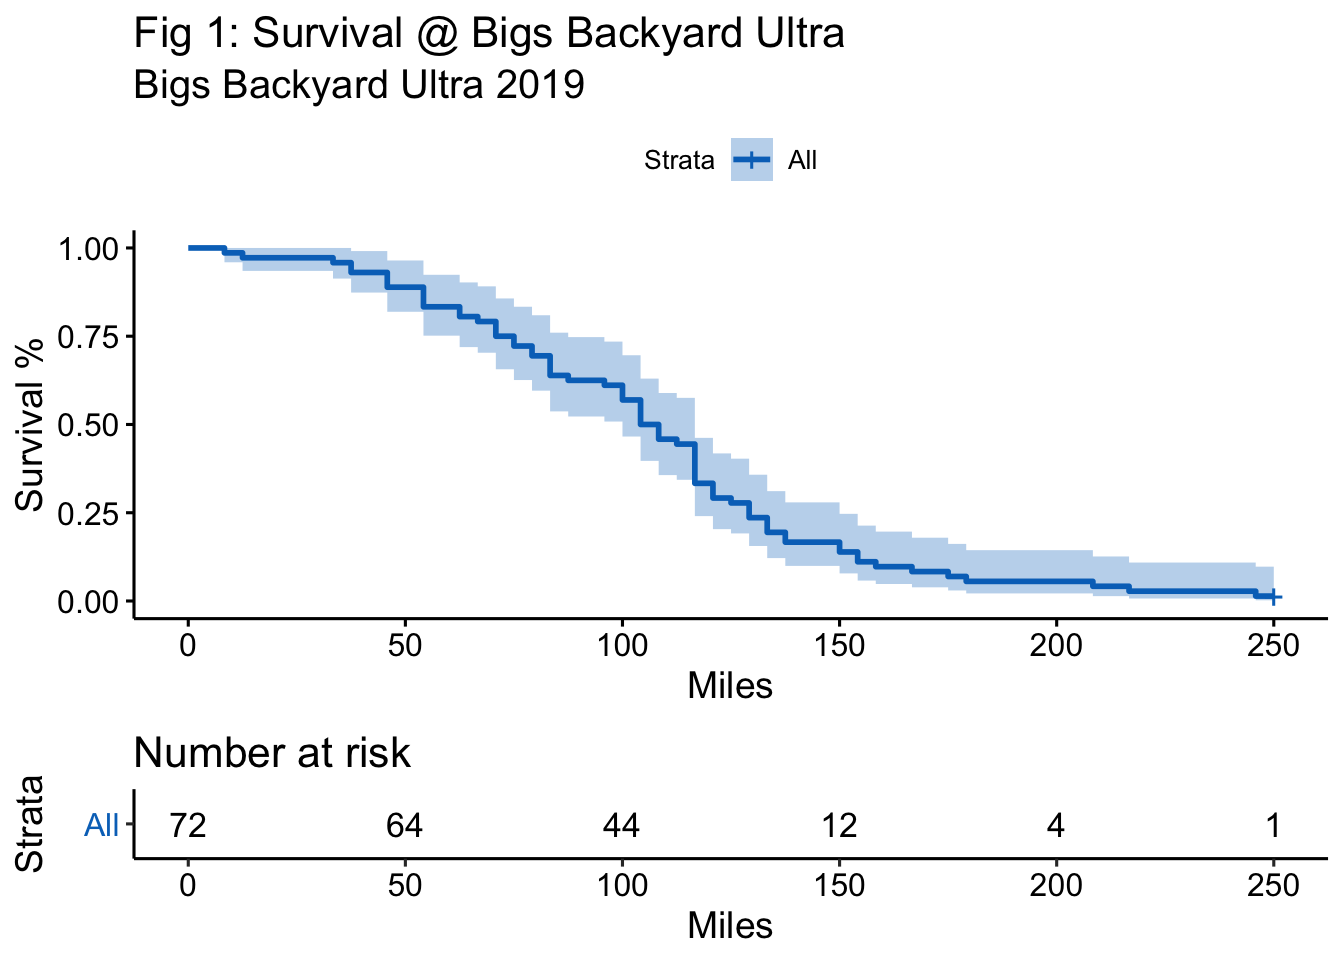
The runner drop off is quite steep starting at about 100 miles and continuing to about 150 miles. In this section the vast majority of runners drop from the race. In fact, at the start of the 50th mile only 8 of the 72 runners have left the race. 100 miles after this, at the 150 mile mark there are only 12 runners remaining. It takes another 100 miles for the field of 12 to breakdown to the lone champion (Maggie Guterl).
Over the course of the two and a half days the field combined to run 7,663 miles. The miles accumulated as shown in the plot below.
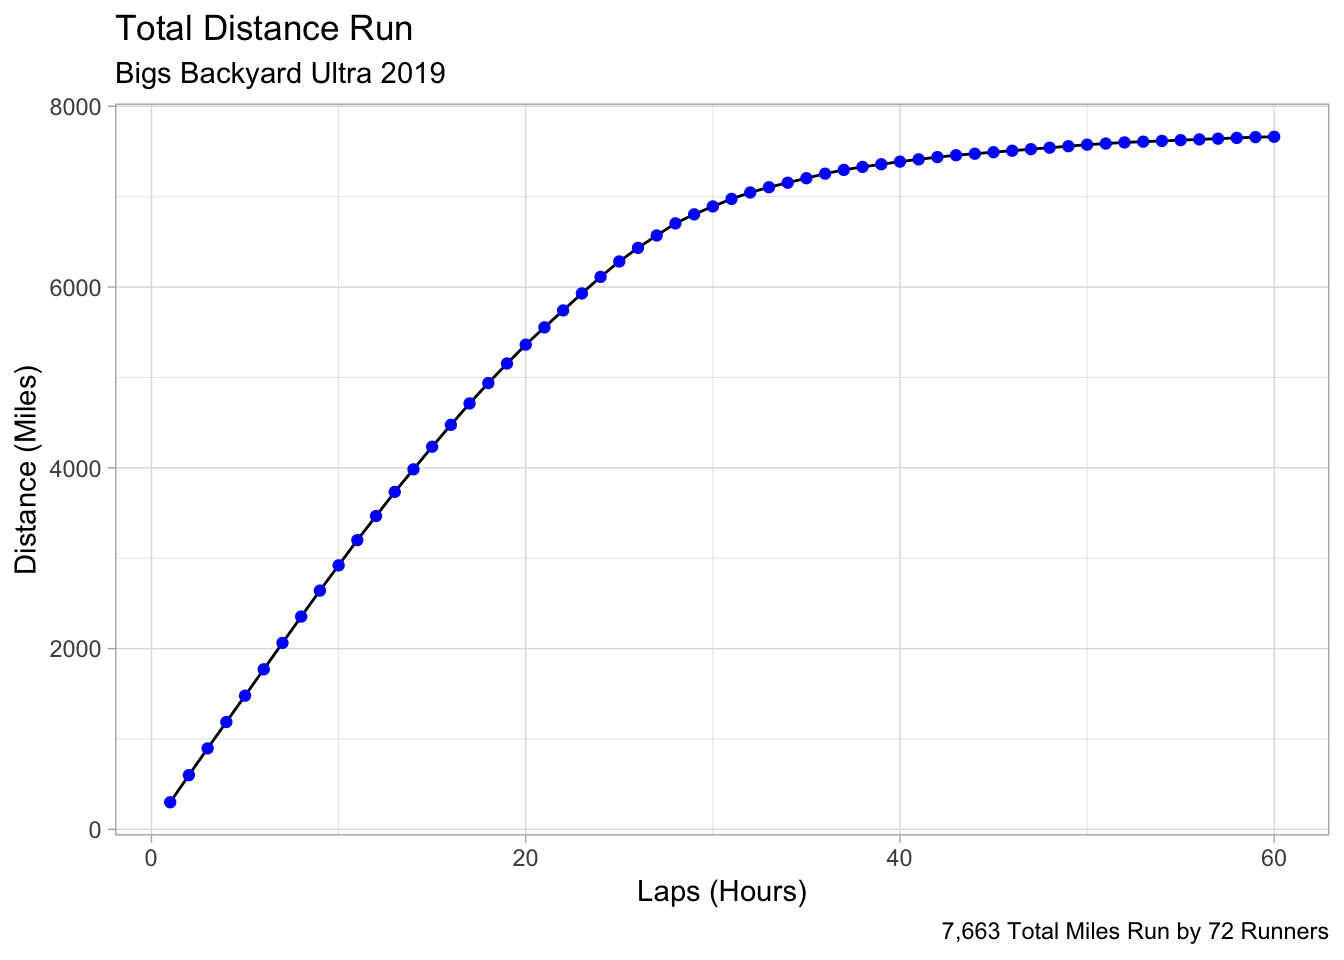
Each lap is 4.1667 miles. For the first 20 or so laps the total amount added at the conclusion of each hour was pretty similar to the hour before. The bend in the chart starting at about 20 hours is indicative of more and more runners starting to leave the field.
All ultra running involves racing strategy. There is probably more strategy in this format than traditional formats. Runners can complete loops as quickly or as slowly as they desire. There are no points for finishing the loop the quickest. There appears to be a trade-off between loop speed and resting time at the start/finish. Runners need time in between loops to take care of themselves, use the bathroom, sleep (maybe?). But they also do not want to overly exert themselves by running a lap too fast.
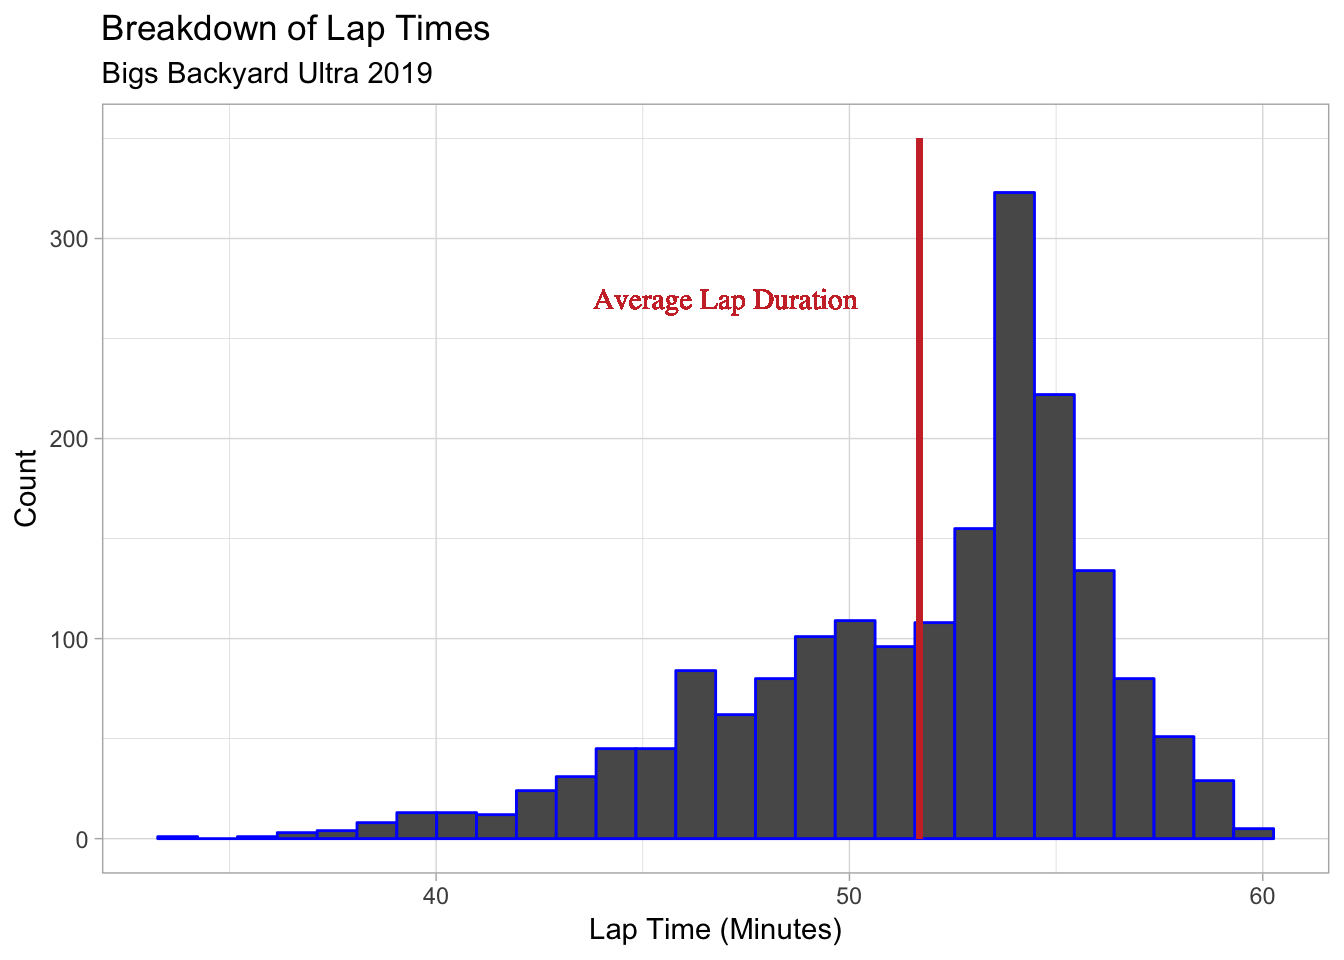
In this year’s field the average loop time spent on the course each lap was 51 minutes and 42 seconds. The plot below shows the spread of lap times across the whole race.
Conversely, the average time spent resting in-between laps was 8 minutes and 17 seconds. The spread for resting across each lap is shown below.
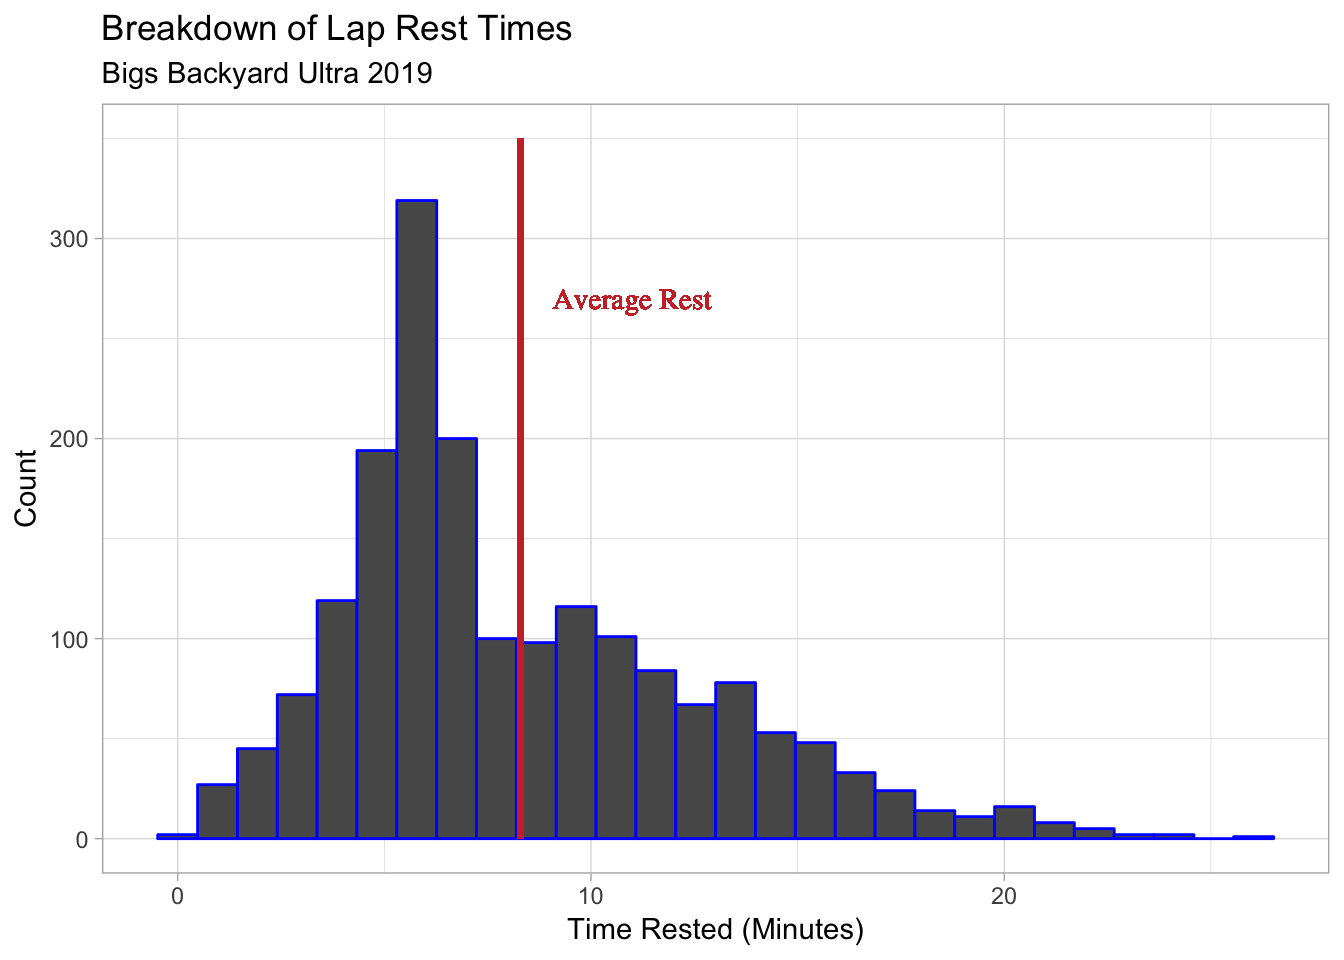
As you can see from the above plots, there was a spread in both lap time and resting time. Runner’s employed different strategies to handle this backyard ultra.
Looking at the top ten finishers we see a pretty big difference between strategies. Of the top 10, Dave Proctor (3rd) led the way with an average lap time of 46 minutes. This gave him about 14 minutes at the start/finish in-between laps. On the reverse side, several runners spent on average between 53 and 54 minutes on the course each lap (including runner up Will Hayward).
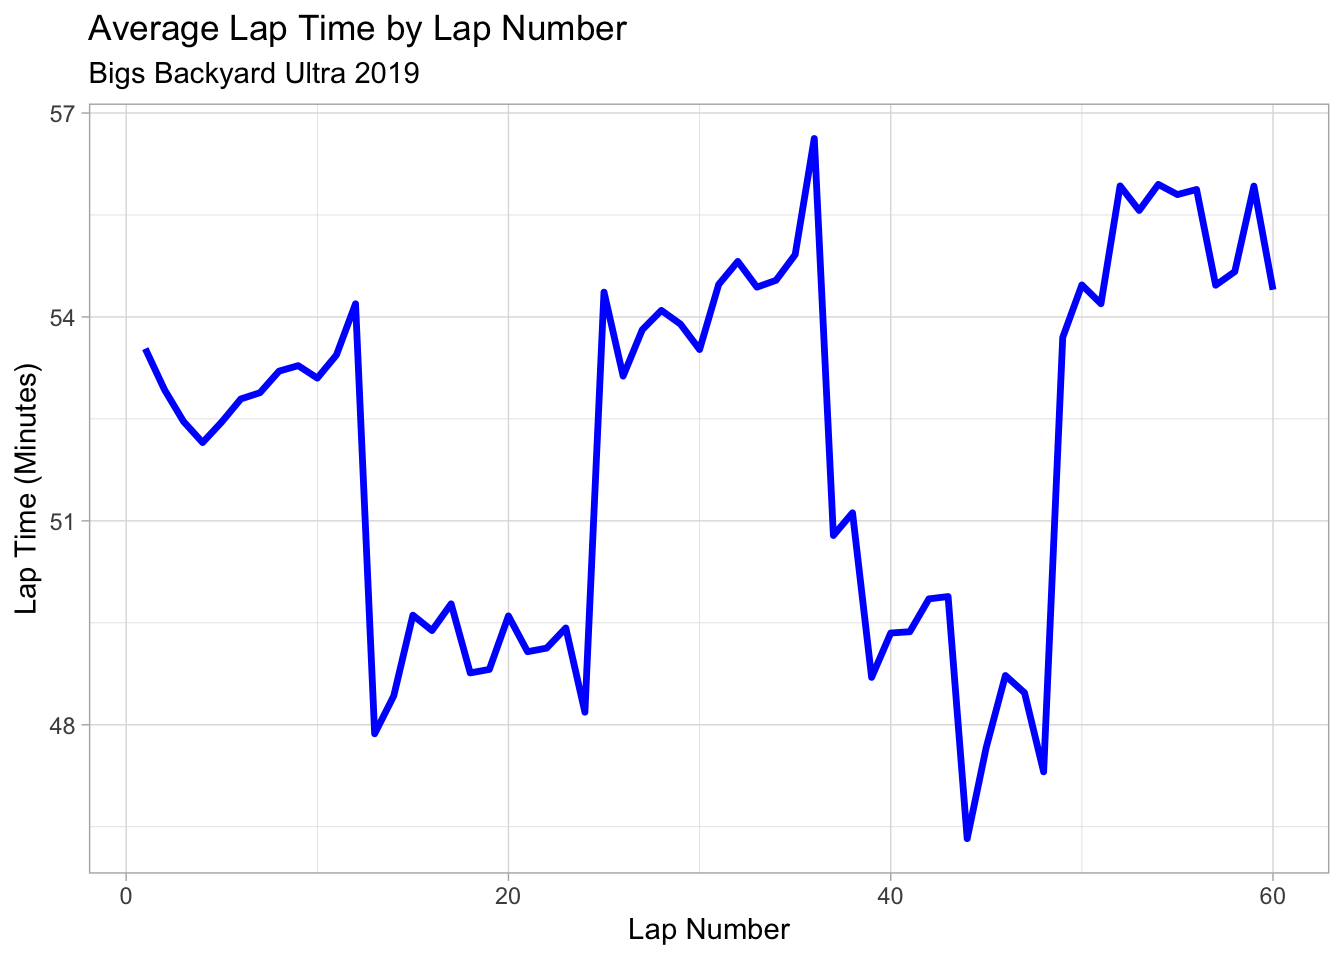
There was also a difference in lap time completion due to the time of day. During the daytime hours runners ran laps on a trail around Laz’s property. Throughout the nighttime hours they transitioned to run an out and back primarily along a road. The difference in terrain accounted for a few minute average difference in lap completion time. As excepted, runners tended to complete laps quicker on the rad as opposed to the trail.
Shown below are average lap finishing times across each lap number.
This was just a preliminary look into the data coming out of the 2019 Bigs Backyard Ultra. As I dig further into the data I’ll add future posts. If there is anything specific you’d like to know data-wise about this event don’t hesitate to reach out.