Survival Analysis is a process of determining when an event is likely to occur. It is often used to model patient outcomes in pharmaceutical studies and component failures in mechanical systems. In the mechanical space, knowing the expected lifespan of a part in service can be useful for warranty and planning purposes. A part is defined as in-service until it breaks or fails. The time the part was in service (or the number of miles it was in use) can be referred to as its lifespan.
Survival Analysis can be applied to almost any field. For instance, we can use it to look at the finishing rate of ultramarathons. It can be used to provide insight into when runners drop out, and how the drop out rate breaks down by other factors such as age or gender.
The 2019 WSER provides us a medium to apply survival analysis to an ultramarathon data set. The event of interest is when a runner drops out of the race. The 86.4% finishing rate of 2019 is the highest finish rate at Western States on record.
A Kaplan-Meier plot is one of the main visualization tools in the survival analysis toolbox. It shows the finishing rate across race mileage. On the x axis it shows mileage (or lifespan) and on the y axis it shows survival probability (probability of making it to the corresponding mileage). The overall Kaplan- Meier plot for the 2019 WSER is shown below.
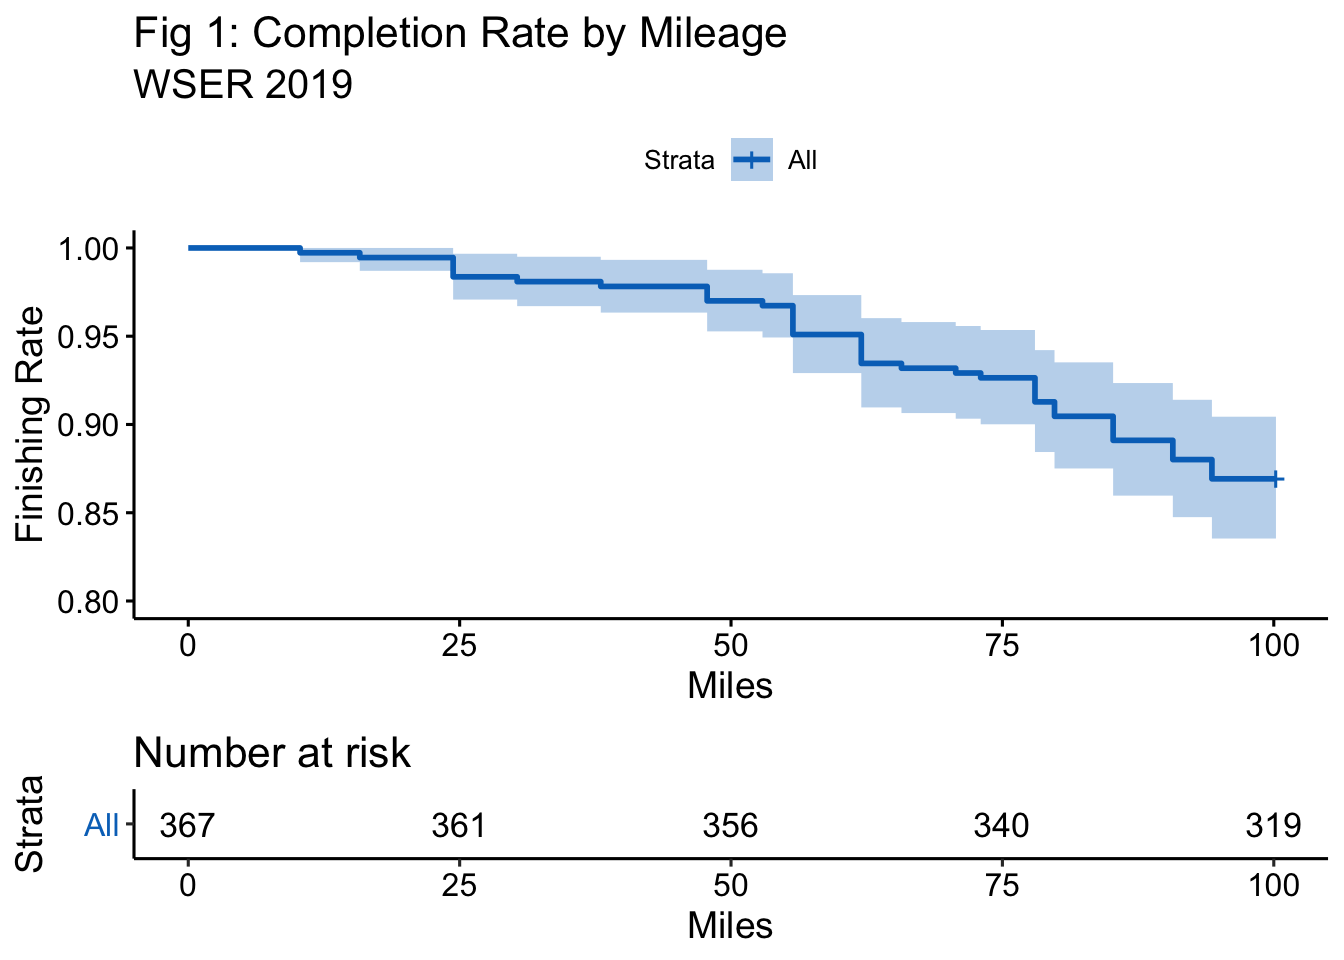
Figure 1 shows the runner completion rate through each mile of the race. The data for this analysis was taken from ultralive.net. It gives results through each aid station along the course. That means, it tells us who dropped out at each aid station thus ending their race. The red curve starts at 0 miles with 100% completion and terminates at the finish line with an 86.4% completion rate. Along the way from 0 to 100 miles, 13.6% of the field drops out of the race. The red line tracks when these drops occur.
In addition we can see how age and gender affect the curve. Age can be broken up into three groups: those less than 35 years old (we will call the kids), those between 35 and 50 (prime agers), and those older than 50 (salty veterans).
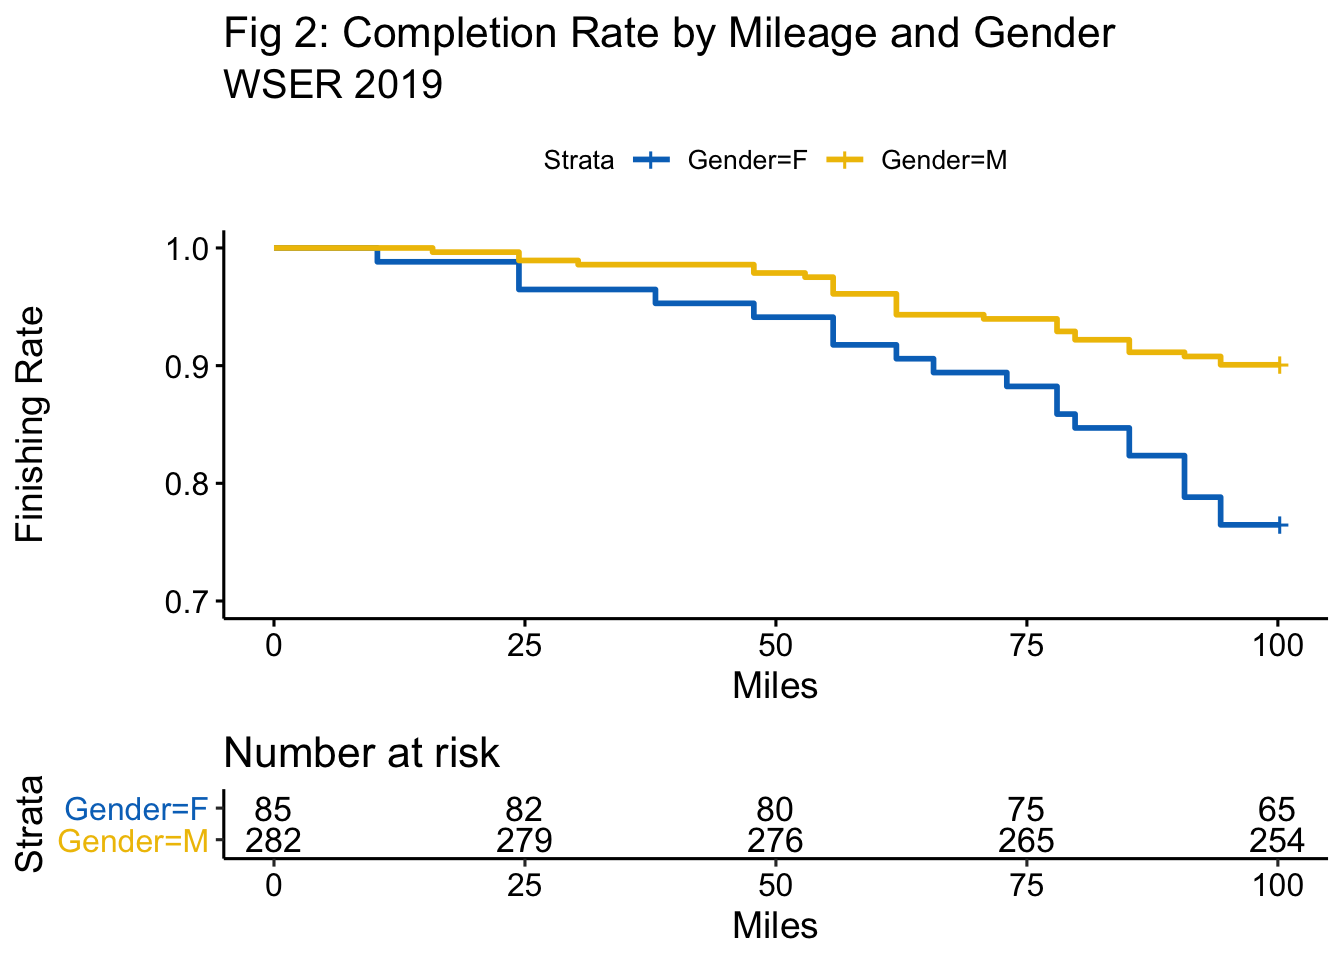
Gender: The gender gap for finishing rate is shown below in figure 2.
Age: And the same for our age categories is shown in Figure 3.
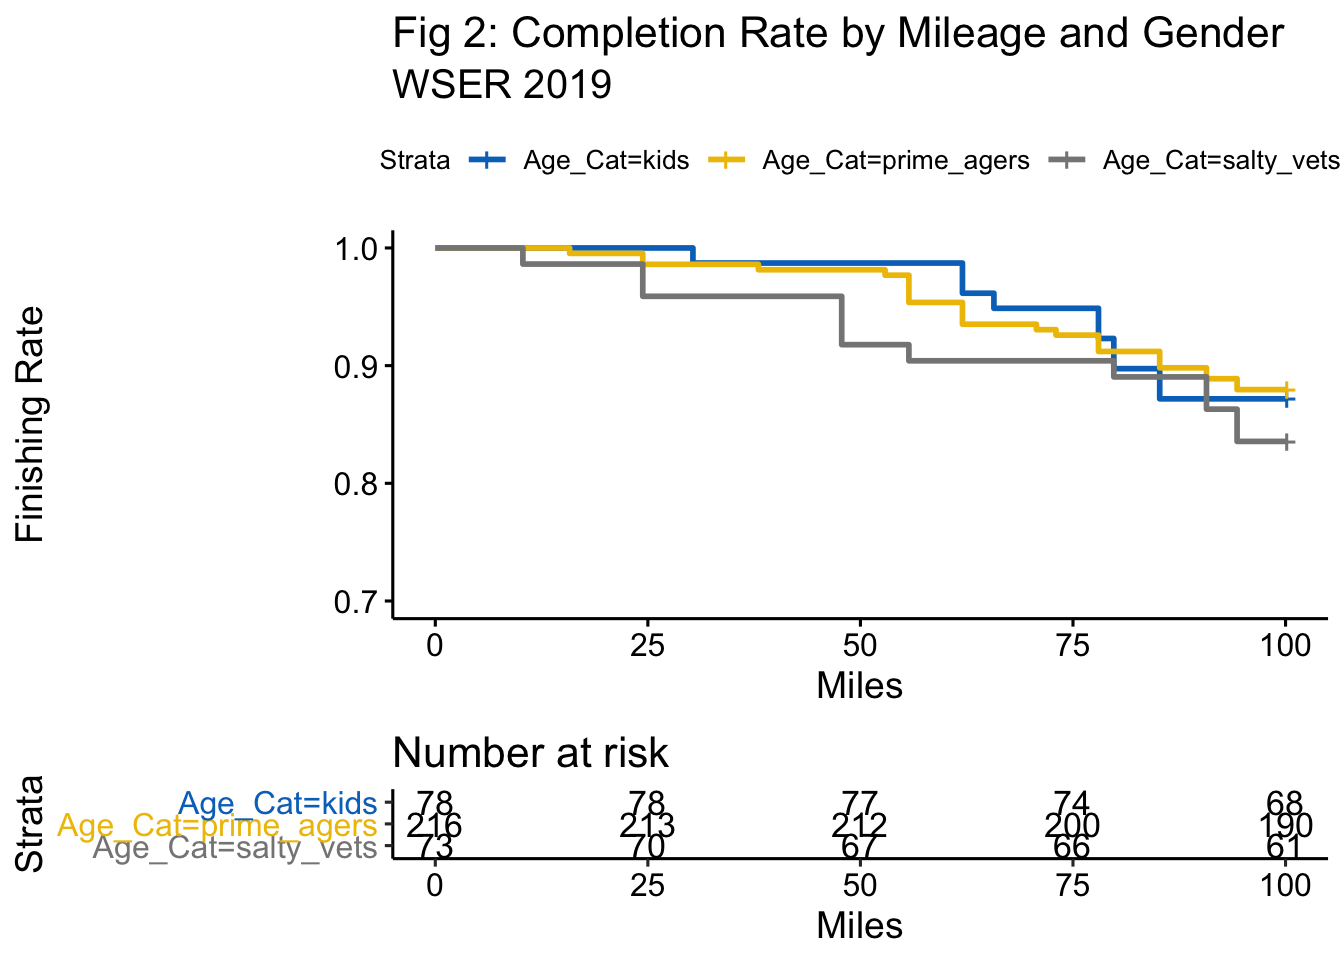
Figure 2 and Figure 3 show differences in completion rate by gender and age. Is there some sort of interaction between these factors. That is, is the effect of gender on completion rate different across the age categories (and vice versa)?
To answer this question we can create kaplan-meier plots for each combination of age and gender. The result of this is shown in Figure 4.
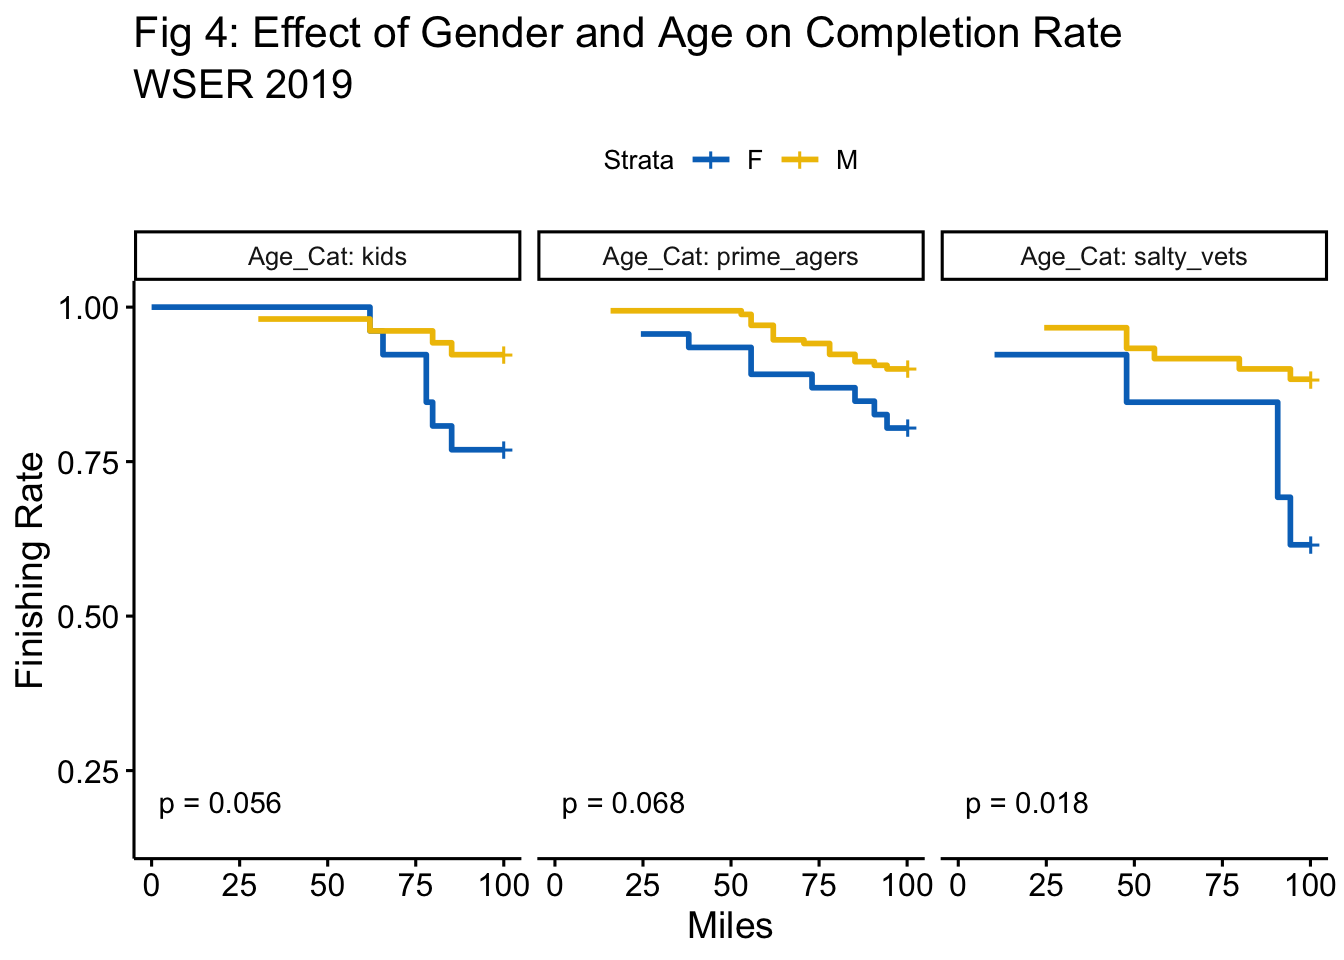
The pvalue provides a test of significance between the two lines (yellow and blue). Using the standard (0.05 threshold) it appears that there is only a significant difference between men’s and women’s finishing rate at the age level of salty-vet. For the salty vets (those over age 50) the women have a lower completion rate than the men. For the other age categories we cannot make this same statement. There is not enough evidence to suggest a difference in completion rate among men and women for both the kids and prime agers.
This analysis could be improved by looking at more data over a larger time period. At some point in the future I hope to revisit this analysis to include more years worth of data and other factors such as weather and snow-pack.