Entry into the annual Western States Endurance Run is capped at 369 runners. The number has remained around this mark since the creation of the Granite Chief Wilderness in 1984. Of these 369 slots the majority are assigned through the process of a lottery.
In addition to the lottery, some slots are assigned automatically in a variety of ways. Most of these automatic slots are given to volunteers, sponsors, elite athletes, or runners going for a milestone finish. For instance, runners who are attempting their tenth finish or twentieth finish are automatically given entry into the race.
The most notable automatic entry path into the race is to be a top 10 Man or top 10 Woman from the previous year’s WSER. If you finish in the top 10 at the WSER in a given year you will be automatically given entry into the race the following year. As you can imagine, these 20 spots (10 for Men and 10 for Women) are highly competitive. And incrementally the time needed to finish within the top 10 threshold is pushed lower and lower. These 20 runners are also given the distinction of being assigned the first 20 bibs of the race (M1 through M10, and F1 through F10).
Figure 1 below shows the top 10 Mens and Womens times between 1980 and 2019. Each point is an individual runner’s time for that given year.

The blue line provides a best fit to the data. As you can see, there is a downward trend overtime. This downward trend indicates the increasing competitiveness at the front end of the WSER for both the Women and the Men.
Figure 2 shows this same data in another light. Each year is given a band showing the times comprising the top 10 for a given year. The top of the band gives the tenth place time (last automatic slot), the bottom of the band gives the first place time (first automatic slot), and the average top-10 time (elite) is given by the dot in between the top and bottom of the band. In order to be an elite automatic qualifier a runner would have had to finish at or better than the top of the band for each year.
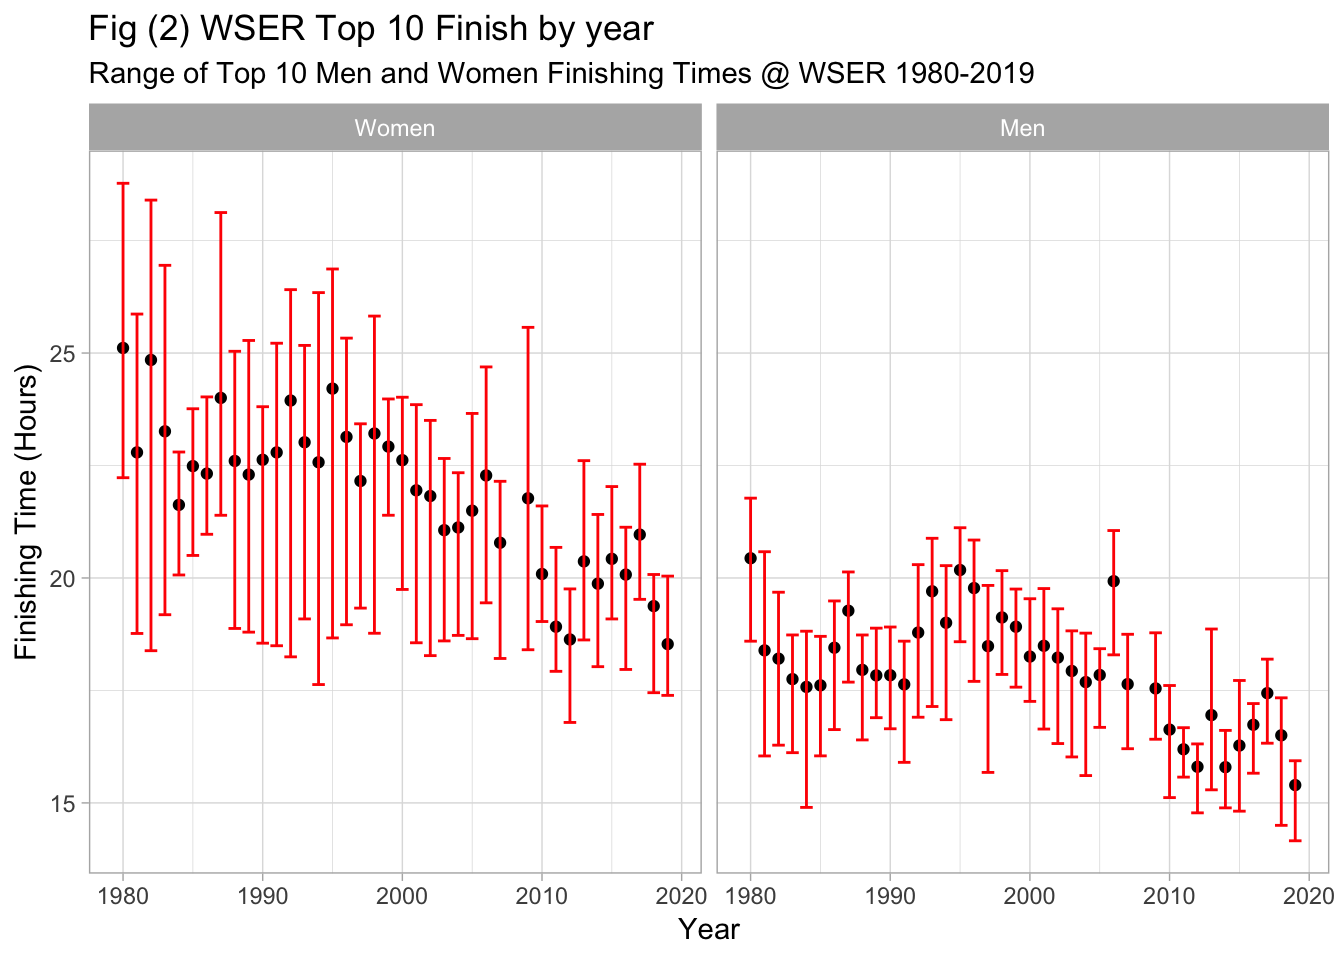
The red bands vary from year to year in both length (elapsed time difference between first and tenth finisher) and average time. The smaller the length of the band the more close together the top 10 runners finished, the larger apart the band the more spread out the top 10 runners finished. Again, the slight downward trend in both the Womens and Mens times suggest increased competitiveness from year to year.
This decay is not exactly linear from year to year. There are years where the average elite finishing time increases from the previous year (2006 is an extreme case). There are obvious factors that effect the average elite finishing time: weather and temperature being two of the largest factors.
What will the average automatic entry threshold look like a year from now? What about two years from now? To investigate this we can apply a simple time-series prediction in the form of an autoregressive model. Figure 3 and Figure 4, shown below, show the results of this fitting process. The solid blue line gives the estimated average elite finishing time (top 10 finishers by gender) for 2020 and 2021.
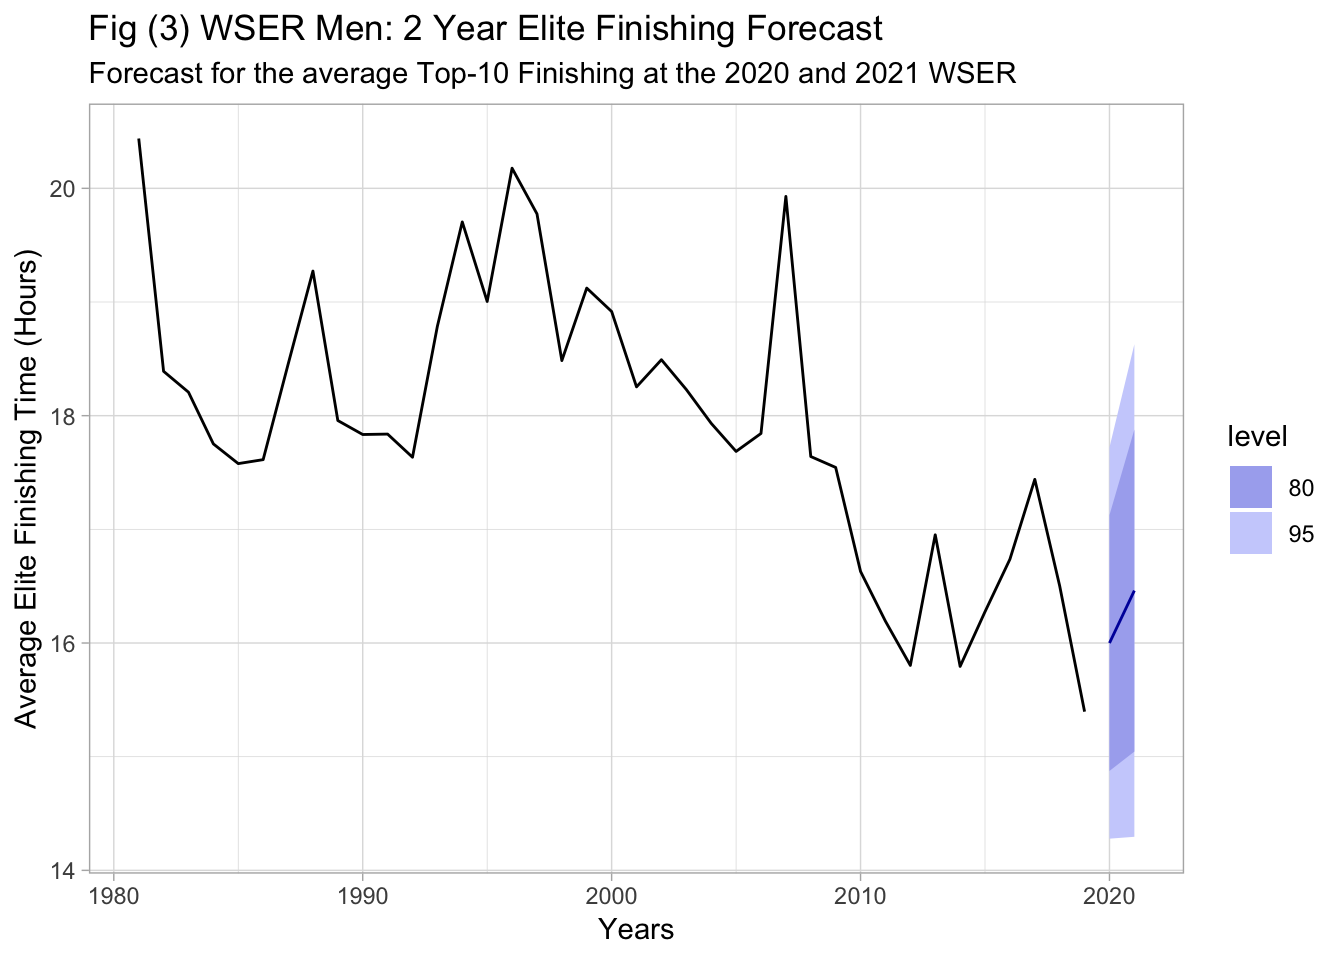
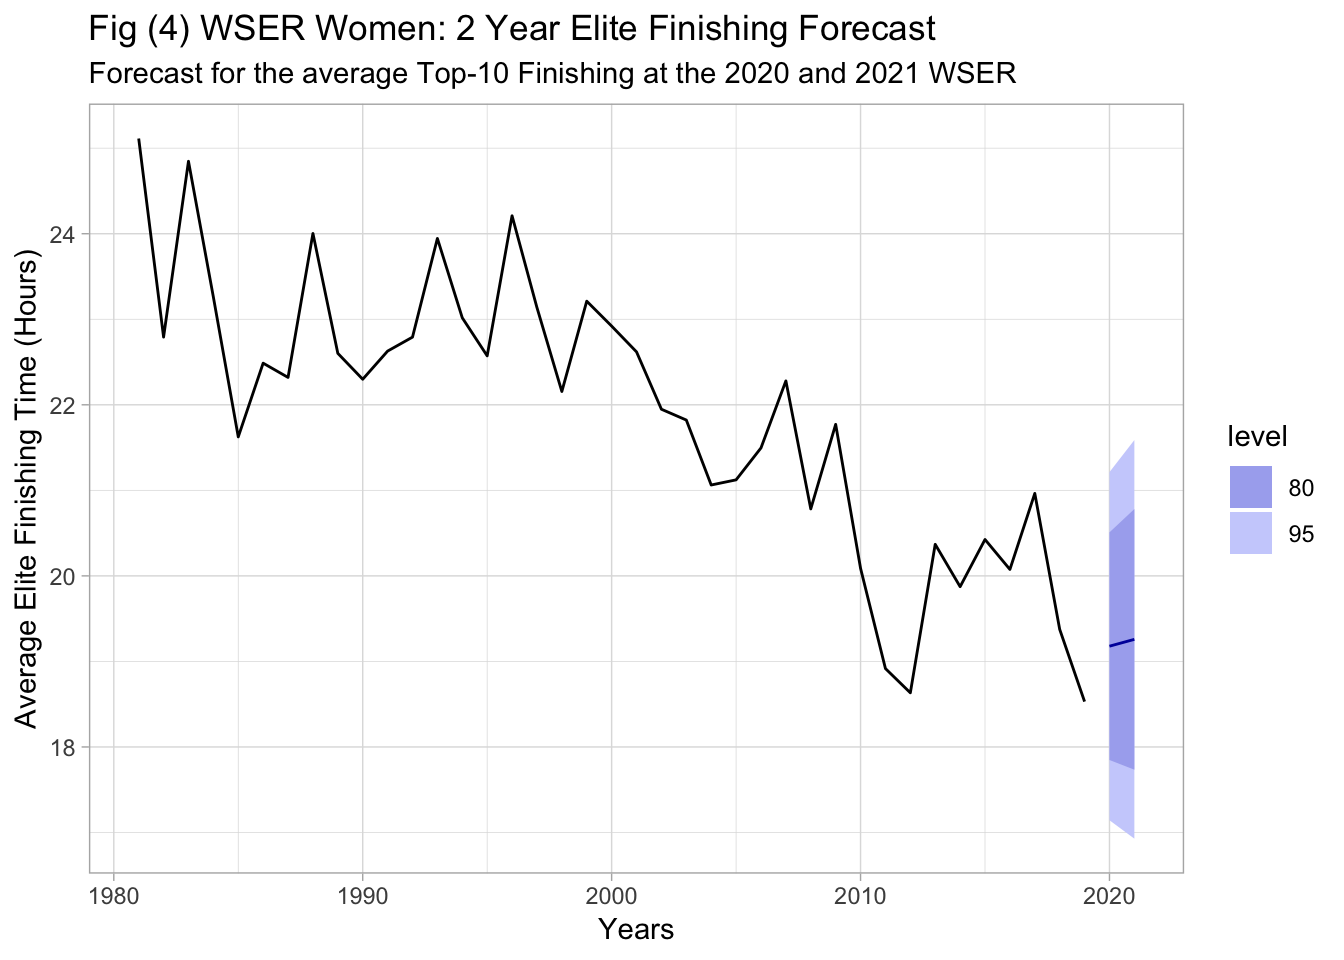
These forecasts are very rough. The predicted average elite finishing time for the 2020 WSER is 16 hours for Men and 19 hours and 10 minutes for Women. This would be a half hour increase from the 2019 Mens average elite finishing time, and a 40 minute increase from the 2019 Womens average elite finishing time.
The blue shaded regions on either side of the solid blue line provide confidence intervals at 80% and 95%. These are quite wide indicating the uncertainty around these forecasts. In general, we can expect a slight uptick in the average elite finishing time going into next year’s WSER. This makes some sense, this past year (2019) saw unprecedented finishing times due in part to the unexpectedly good weather. If the weather reverts to a hotter temperature next year, it probably makes sense that the cut-off time needed to finish within the top 10 would increase. However, as stated before there is a lot of uncertainty around these forecasts.
The major take away from looking at these graphs is that the elite WSER runners are generally getting faster. They are faster today than they were in 1980 or 2000. It is getting more difficult to automatically qualify for the WSER. This trend is gradual and is variable from year to year due in part to variability in the weather.