Jim Walmsley recently ran the 2019 Western States Endurance Run in a breathtaking 14:09:28. He broke his own course record (2018) by a good 20 plus minutes. For an inland California midsummer, the weather was uncharacteristically comfortable. The high temperature of 83 degrees was the lowest race time temperature since 2012.
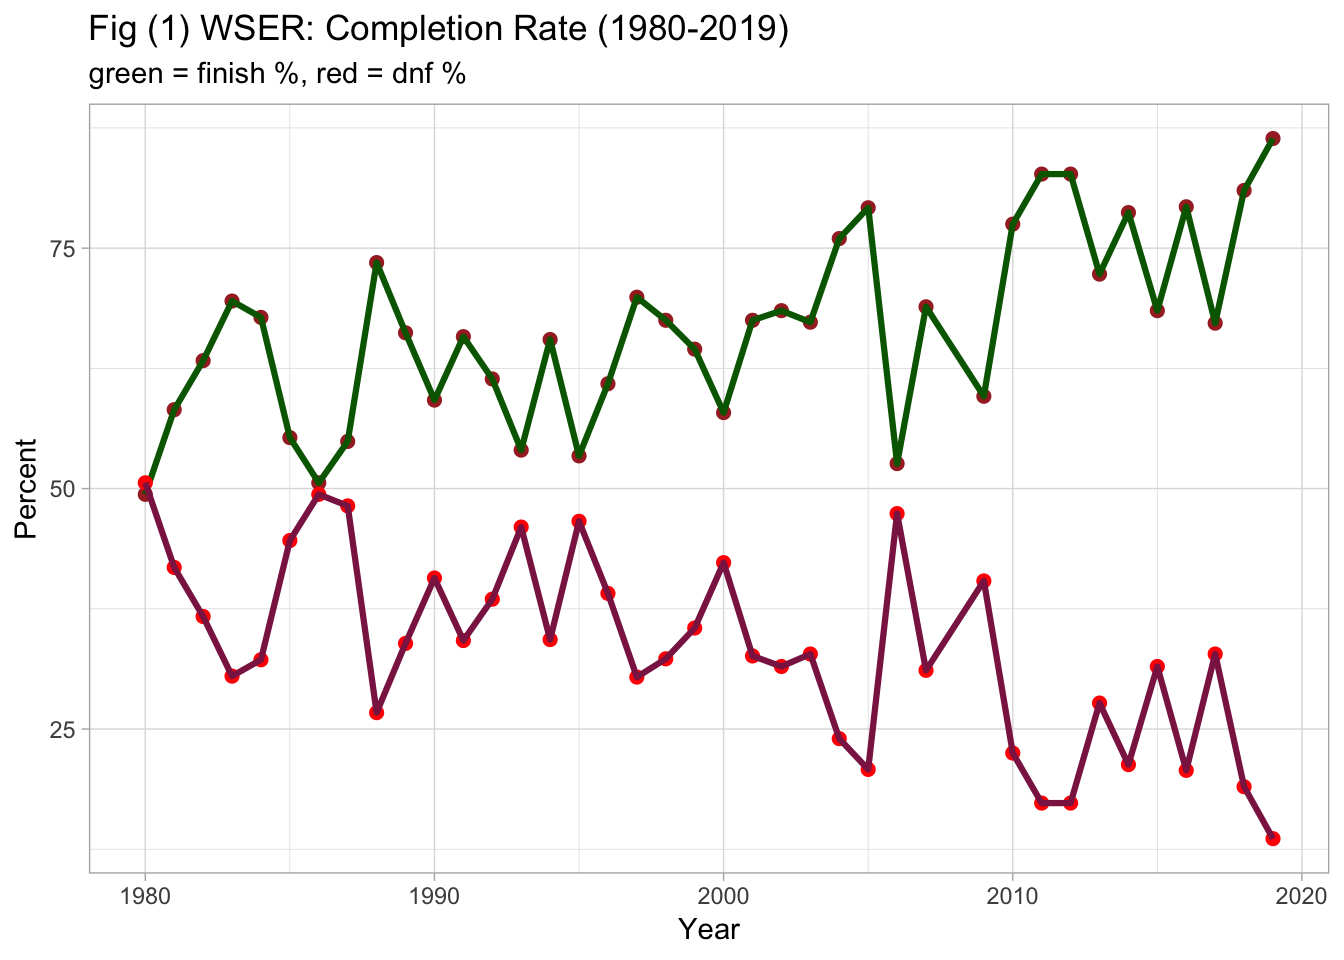
Undoubtedly, the cooler weather aided in the runners’ efforts. Aside from a shattered course record, this year saw a record percentage of runners completing the race (86.4 %). Of the 369 race starters, 319 earned a silver or bronze buckle. Since the mid 1990s (with some obvious exceptions) the completion percentage at the WSER has crept ever higher. There is an obvious trend toward more runners finishing the race. Figure 1 shows WSER completion by year from 1980 on-wards. The green line represents completion percentage, the red line represents DNF percentage. There is a general divergence between these two lines. Red is pushing down, while green is moving up. This means more runners are completing the course in regulation time at the expense of DNFs.
There are surely a number of reasons for this trend. For one, the race has grown immensely in popularity. This growth has forced entry requirements higher and has attracted ultra-runners all over the United States and Worldwide. Also in part: technology, nutrition, training plans, pacing strategies, pain management have all evolved and developed since the race’s founding days. All of these factors gradually improve with the passage of time and may contribute to the higher race completion percentage. This post is not about these factors. Rather it will focus on the other side of the performance coin, an external factor that affects racing performance from year to year and race to race, namely: temperature.
Back to the 2019 running of the WSER. The temperate temperature allowed runners to spend less energy on keeping their bodies cool. These excess stores of energy allowed 130 runners to finish at Silver Buckle pace and 189 to finish within Bronze Buckle pace. A good day for most was had. What would have these numbers have looked like if the temperature had been 10 degrees warmer? What about 15 degrees? What about 10 degrees cooler? That is, how much of an effect does temperature have on a runner’s ability to complete the WSER.
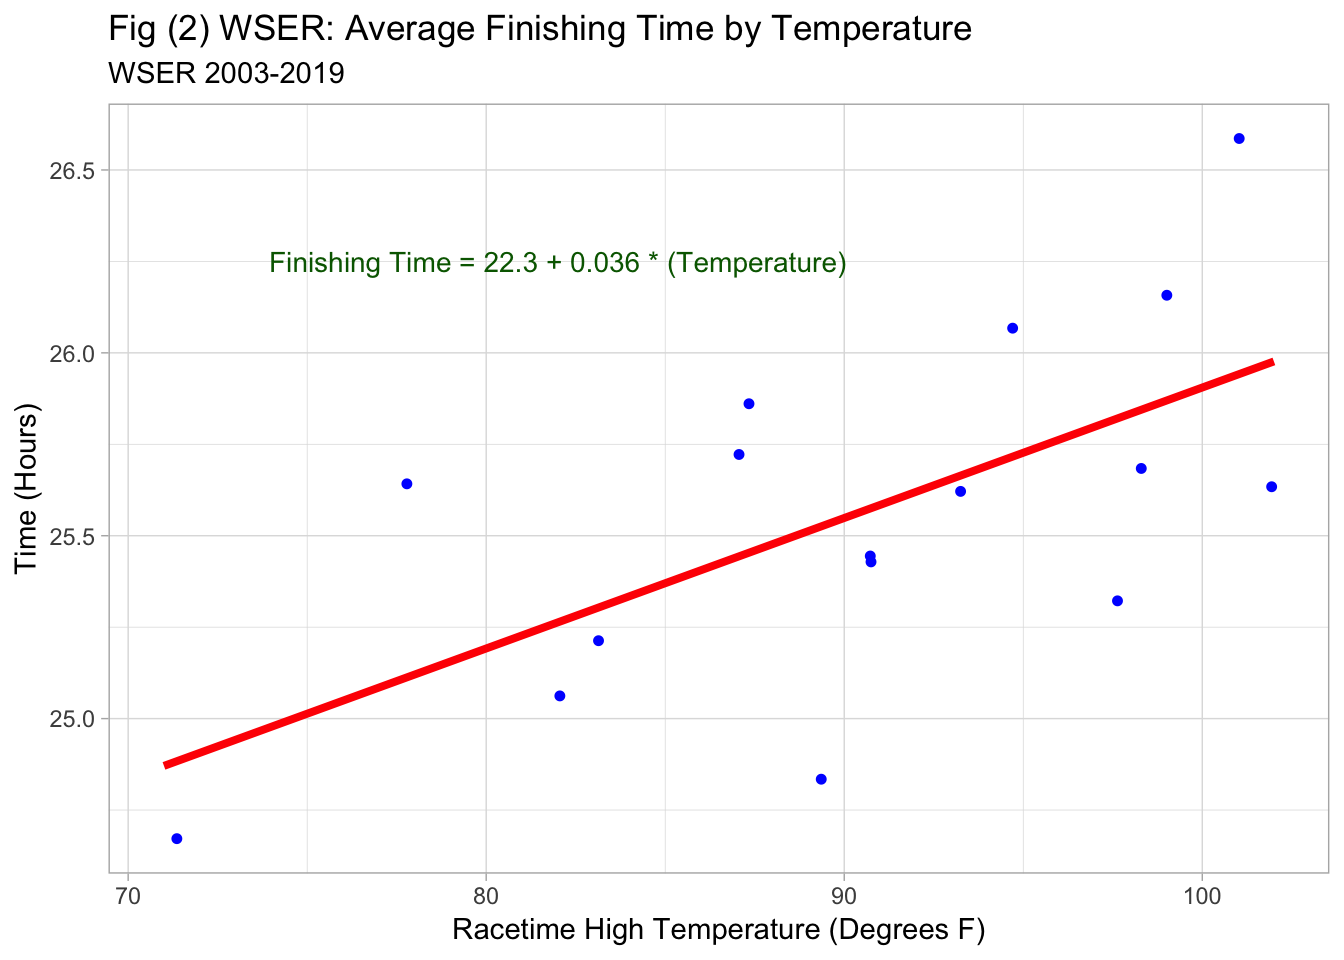
Figure 2 below gives the average finishing time (for all WSER finishers; no DNF data included) for each year between 2003 and 2019 plotted against the high race-time temperature for that given year. There is a clear positive relationship between average finishing time and temperature. That is, as the race-time temperature increases the average finishing time also increases. In fact, the red trend line suggests that for an average finisher every degree increase in temperature will add an additional 2 minutes and 9 seconds to their finishing time. This means that a runner would be projected to gain over an hour to their finishing time between a 70 degree race day and a 100 degree race day. This estimate is representative of the average finisher. It is not exactly representative of a front of the pack runner or a back of the pack runner. This estimate is also blind to the effects of other variables on finishing time such as a runner’s age, the amount of snow-pack, etc. These additional factors will be investigated in future posts.
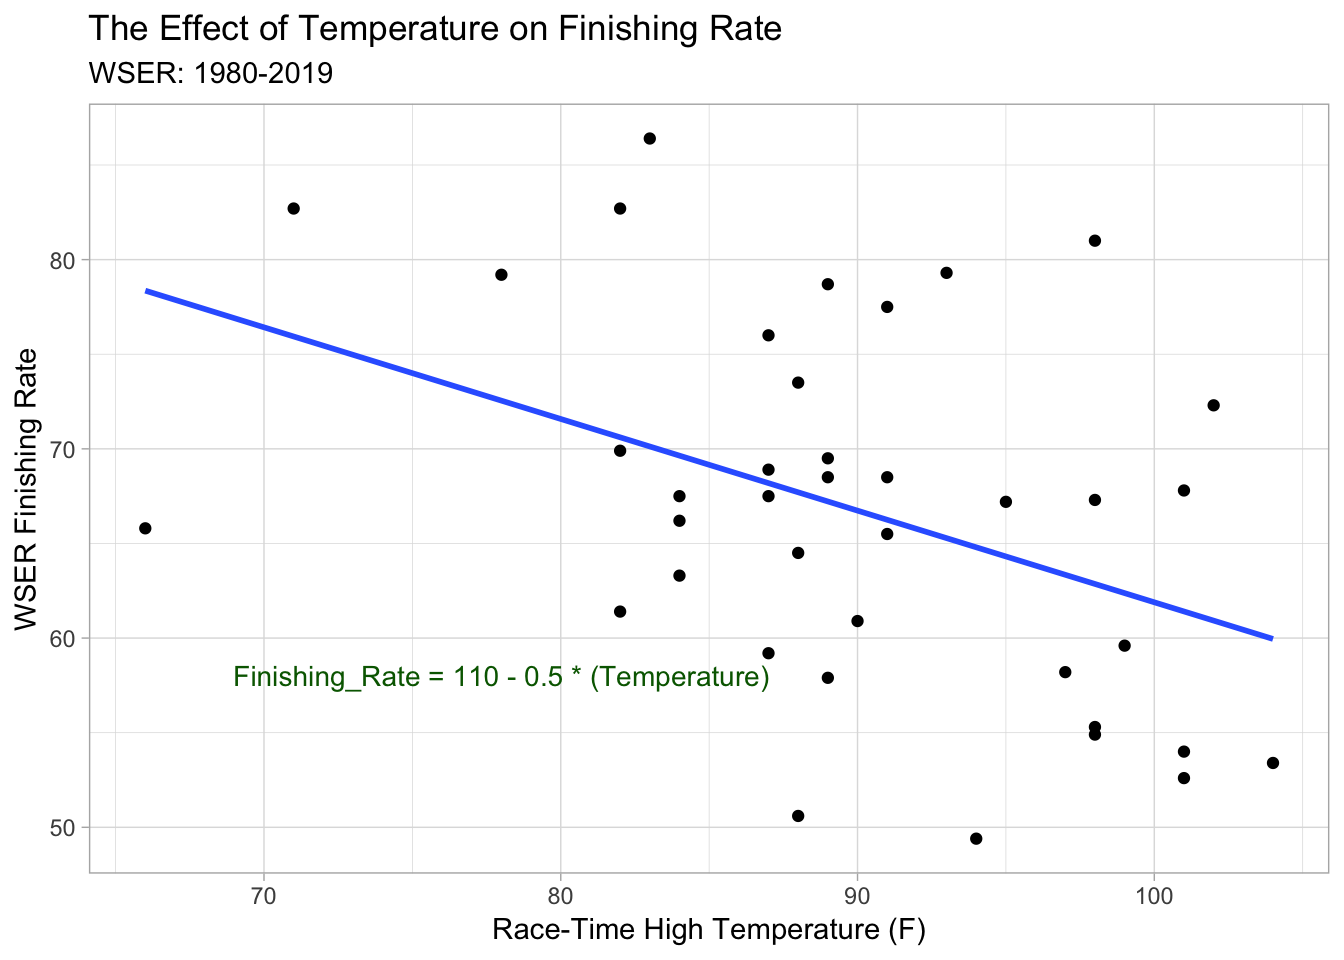
The positive relationship between temperature and finishing time should come as no surprise. A decay in finishing rate is sure to follow. What would this decay look like? Figure 3 shows the relationship between temperature and finishing rate. Here, as expected, there is a clear negative trend. As the temperature increases the finishing rate decreases. The slope for the best fit line is -0.5. This means that for every degree increase in temperature there is a half percentage drop in the finishing rate.
What does this mean for WSER finishers? The table below summarizes the results of this simple investigation. The estimated average finishing time and finishing rate are shown for 4 hypothetical temperatures.
| Temperature | Avg Finishing Time | Finishing Rate |
|---|---|---|
| 70 | 24 Hours and 49 Minutes | 75% |
| 80 | 25 Hours and 11 Minutes | 70% |
| 90 | 25 Hours and 32 Minutes | 65% |
| 100 | 25 Hours and 54 Minutes | 60% |
As a final note: The above plots represent simple ways of investigating the effect of temperature on WSER performance. As stated above there are many other factors that should be considered for an in-depth look into the effect of temperature. I intend to continue looking into this area in more depth by controlling for other important factors.